
Why, and how, do young Londoners currently travel?
Fare City has been working with a group of sixth form students from Northolt High School since summer 2020. Our research provides us with a snapshot of what the needs, priorities and aspirations of young Londoners are for travelling in and around cities, both today and in the future. In our student survey we ask, “Why, and how, do young Londoners currently travel?”

Methodology
Respondents were asked questions which aimed to establish:
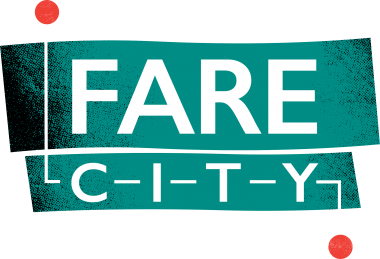
- Which modes of transport students use to travel to school and why they choose these modes
- Whether students work, and if so, how they travel to work
- What activities students travel to, what modes of transport they use, and how far they travel
- Whether staying in the local area is important to students once they leave school
- What the students’ preferred options are for travelling in and around London in the future
The survey had multiple choice answers, but with a provision for students to provide additional information if required. It was conducted between Monday 6th July 2020 and Monday 20th July 2020 using Google Forms. The survey was anonymous and in accordance with the guidelines of the Data Protection Act 2018.
Summary of findings
The survey results provided us with three clear findings which we then focused on in a subsequent webinar with the students: Generation Z – Part One “Why should young Londoners make more sustainable travel choices”
Finding 1
Students value their local area
Though some of the students indicated that they may want to move away from London after they finish school, a large majority of those who wanted to stay in London told us that they would like to continue living in their local area.
Fare City want to encourage students to consider the ways in which they can help to make their local area more inclusive. This could include the use of more sustainable modes of transport and the redistribution of street space, to make neighbourhoods more accessible and equitable for residents and visitors alike.
Finding 2
Ease and convenience are the most important reasons when students select their mode of travel
For travelling to school and other activities, students prioritised modes of travel which were easiest or most convenient. Walking and public transport were commonly used for journeys typically up to twenty minutes in length. For journeys typically over twenty minutes in length, public transport and private cars (with the students as passengers) were the preferred options.
Fare City wants to encourage more students to consider cycling as a viable travel choice, as it can be equally suited to both shorter and longer trips. However, cycling must be made easier and more convenient, not only for students but for all Londoners, especially if it is to replace car journeys for some trips.
Finding 3
Using public transport and using private cars are important current and future modes of transport for students
At the time of taking the survey, students relied on public transport, and to a slightly lesser extent on private cars, for travel to and from a range of activities. Public transport and private cars (predominantly as drivers) were also the students’ two preferred options for travelling around London in the future.
Fare City recognises that the pandemic has negatively, and disproportionately, impacted public transport over other modes of transport. However, public transport must continue to be used by city users, provided that safety protocols are followed. This is because for many cities the alternative is a car-led recovery which would contribute to more congestion, worsening air quality and lower levels of road safety for all road users.
Respondents
| Total survey respondents | 16 | |
| Total female/male split | 10/6 | 62.5%/37.5% |
| Ethnicity split | ||
| Arabic | 4 | 25% |
| White | 4 | 25% |
| Multiple ethnic groups | 1 | 6.2% |
| British (Indian) Asian | 3 | 18.8% |
| British (mixed) Asian | 2 | 12.5% |
| British African | 2 | 12.5% |
| Borough of residence | ||
| Live in Ealing | 15 | 94% |
| Live outside of Ealing | 1 | 6% |
- 25 responses from 16 respondents
- 75% of the students surveyed indicated that they WALKED for all, or some, of their journey
- 44% of the students surveyed indicated that they used PUBLIC TRANSPORT for all, or some, of their journey
- 25% of the students surveyed indicated that they were driven by CAR for all, or some, of their journey
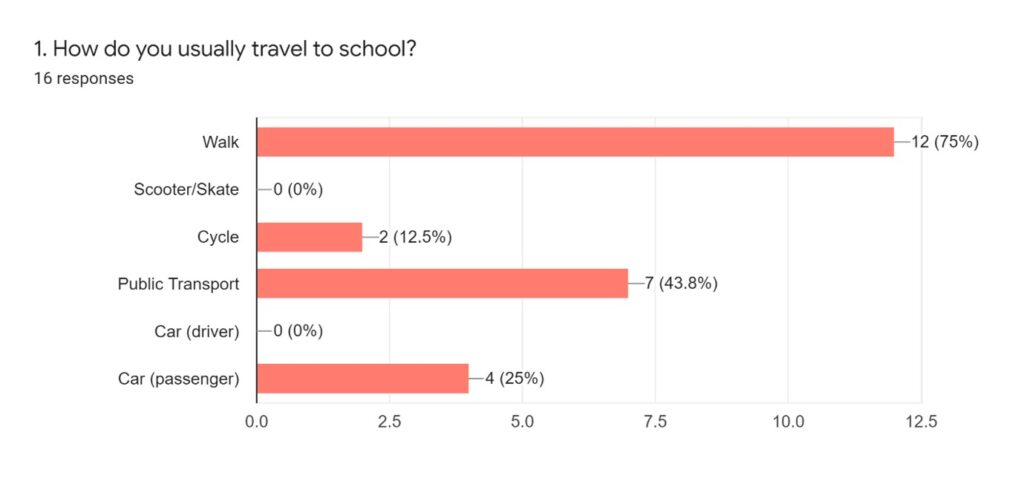
- 38 responses from 16 respondents
- 69% of the students surveyed indicated that one of the reasons for choosing their selected mode was because it is EASIER
- Cost, comfort, safety and enjoyability are less important considerations to those surveyed than ease, speed and health benefits.
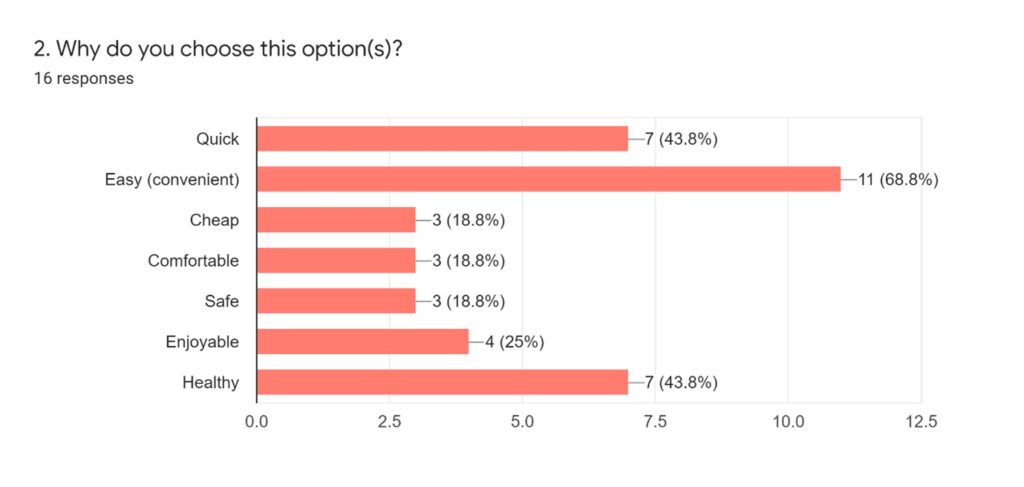
- The highest percentage of student school journeys take approximately 10 – 20 minutes.
- The second highest percentage of student school journeys take approximately 21 – 30 minutes.
- Percentages for student school journeys over 30 minutes in length and under 10 minutes in length are fewest
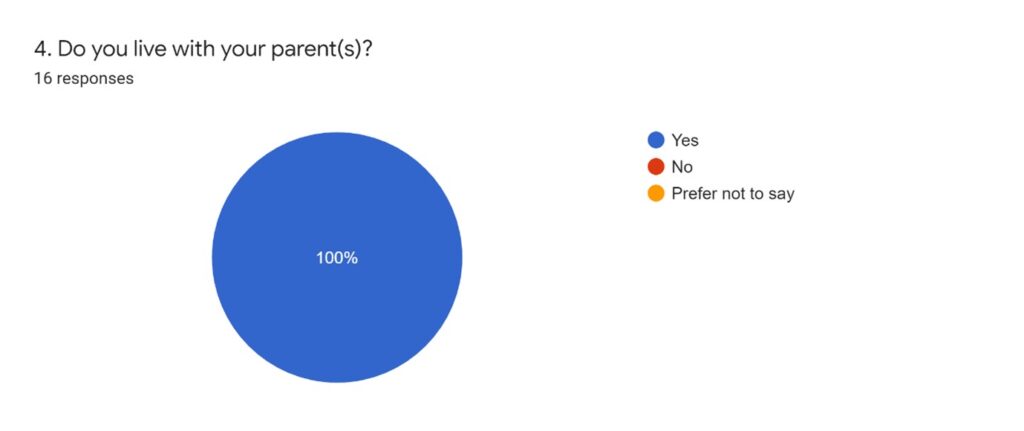
- All students still live at home
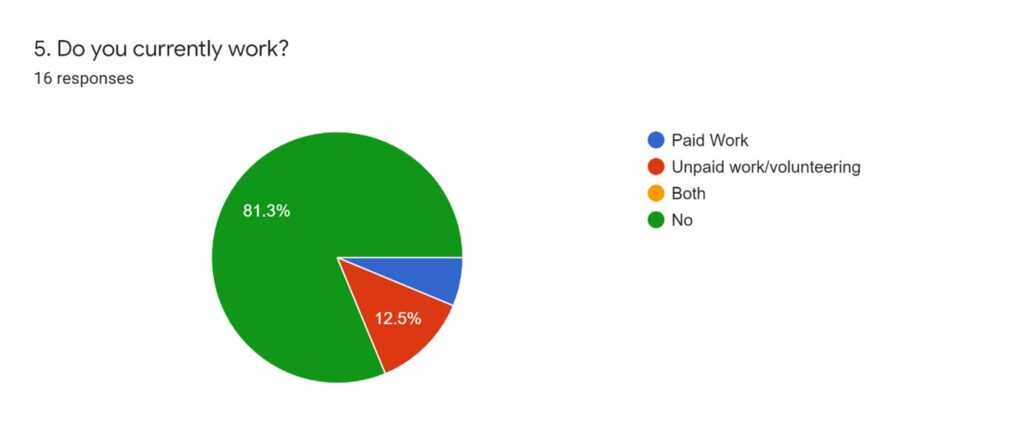
- Approximately 80% of students do not work
- Two students volunteer or hold unpaid positions
- One student works in paid employment
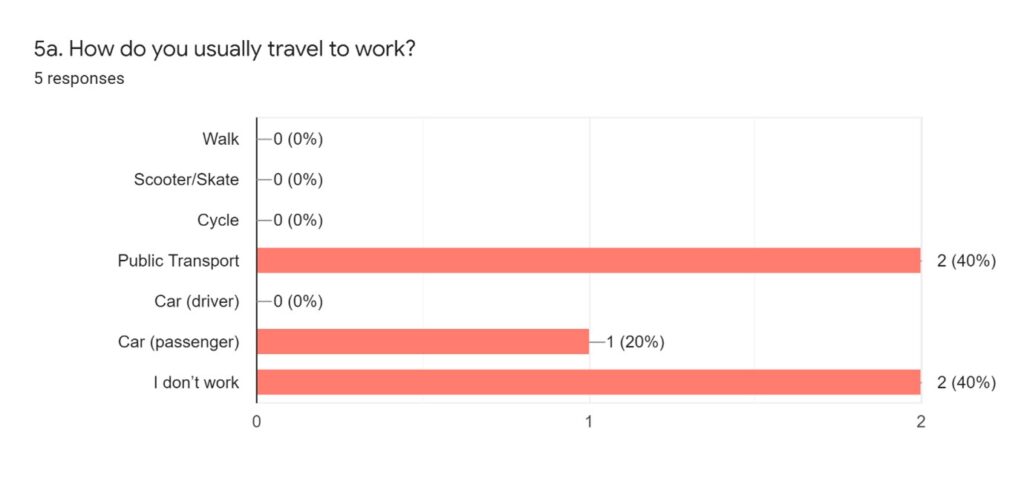
- Three valid responses from five respondents
- Two students who work (66%) take PUBLIC TRANSPORT
- One student who works (33%) is driven in a CAR
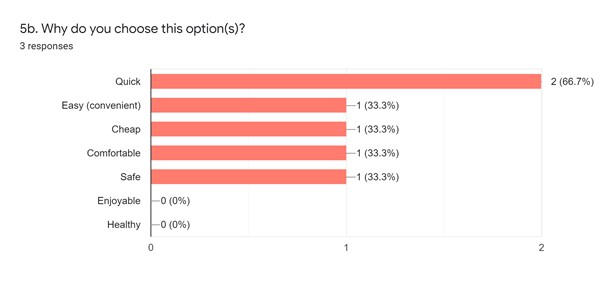
- Six responses from three respondents
- SPEED is the main reason for the students choosing their travel mode
- Ease, cost, comfort and safety are of equal importance
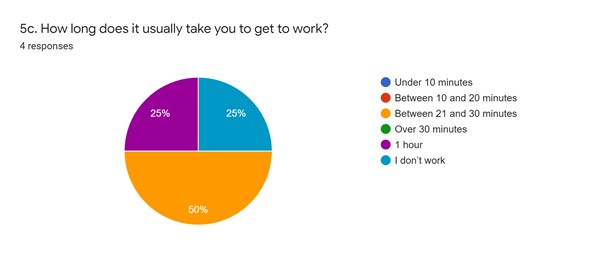
- Three valid responses from four respondents
- The majority of students surveyed take between 21 – 30 minutes to travel to work
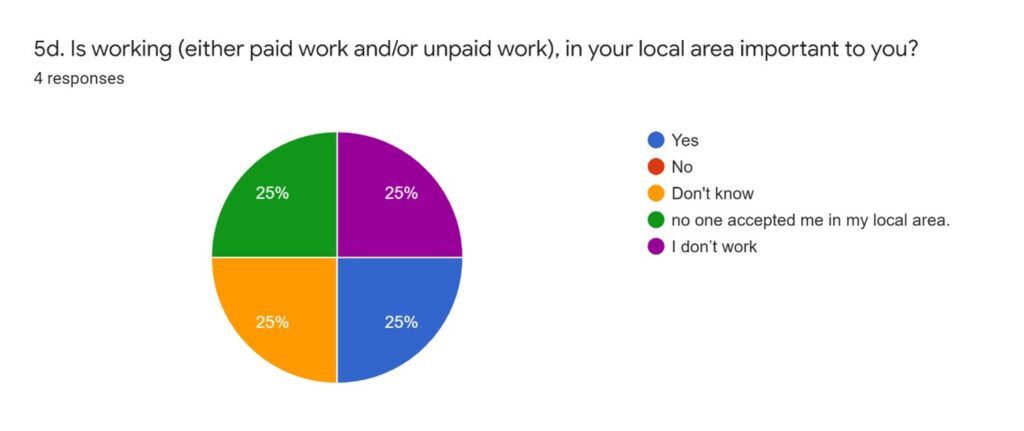
- Three valid responses from four respondents
- Only one student who currently works thinks working in the local area is important
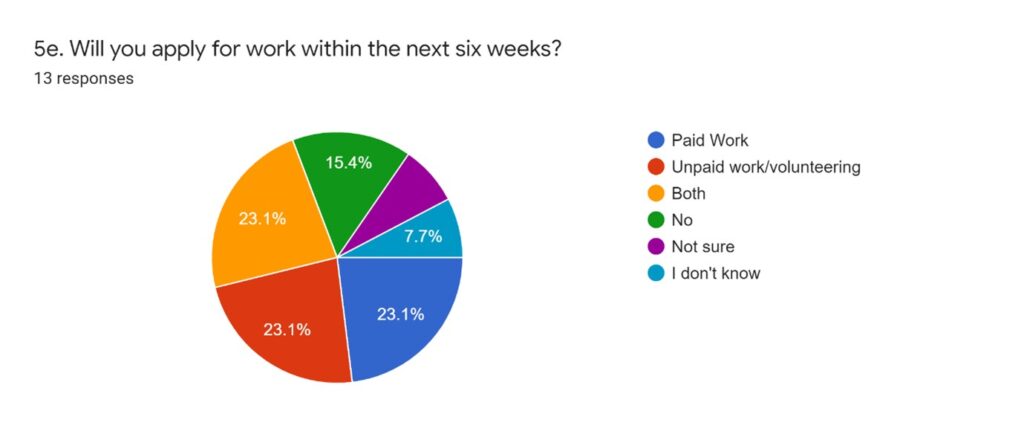
- The majority (70%) of students who do not currently work will apply for some type of work (paid/unpaid/both) within the next six weeks.
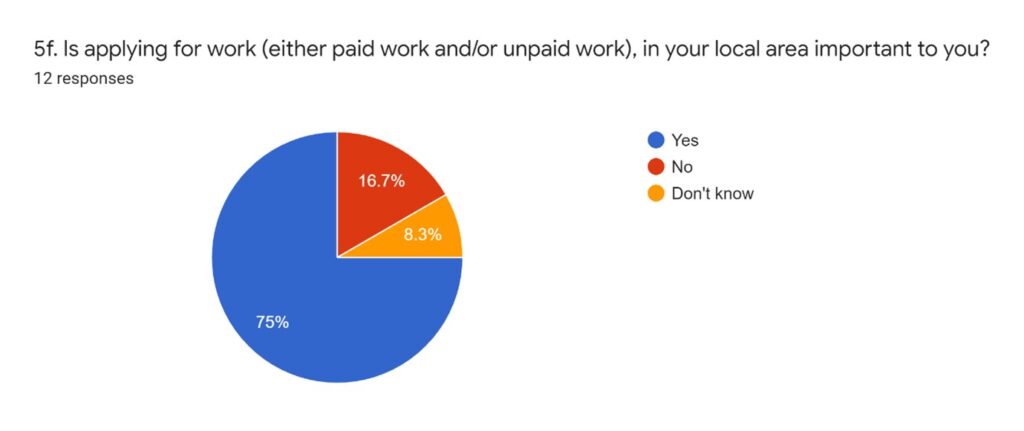
- The majority (75%) of students who do not currently work stated that applying for work in their local area is important to them
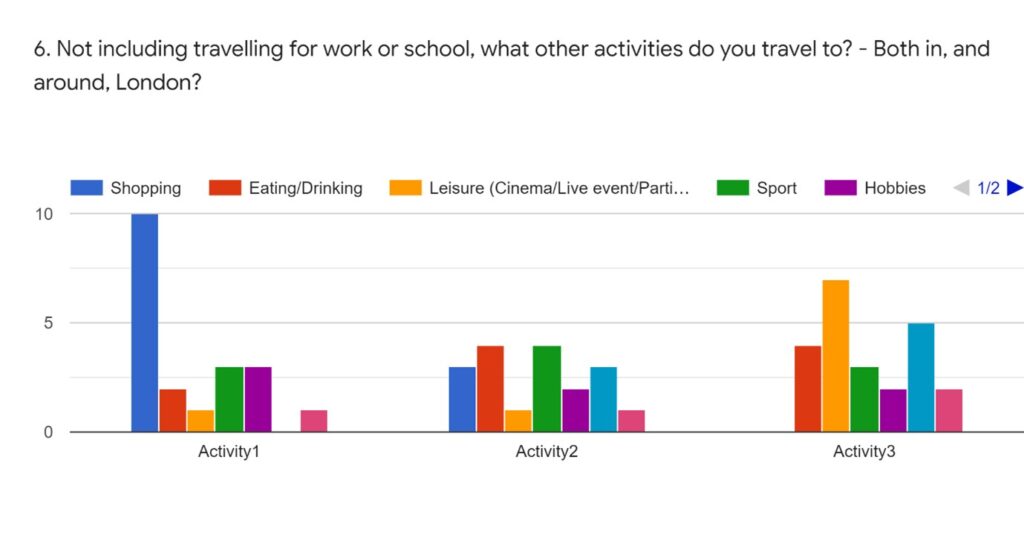
- 61 responses from 16 respondents
- The most popular activity which students travel to is SHOPPING (13)
- A similar number of students travel to eat/drink (10), play sport (10), or take part in a leisure activity (9)
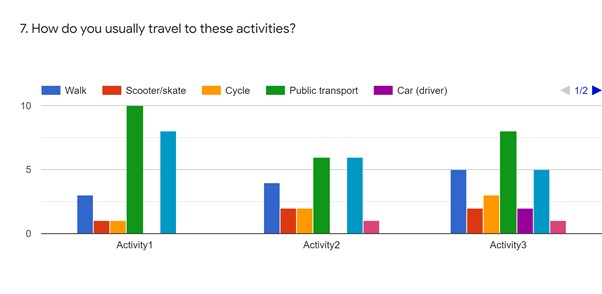
- 88 responses from 16 respondents
- PUBLIC TRANSPORT is the most popular mode of travel used by students, for all or some of their journeys, to take them to their activity/activities (24)
- Being driven as a CAR passenger is the next most popular choice (19)
- WALKING is the third most popular choice (12)
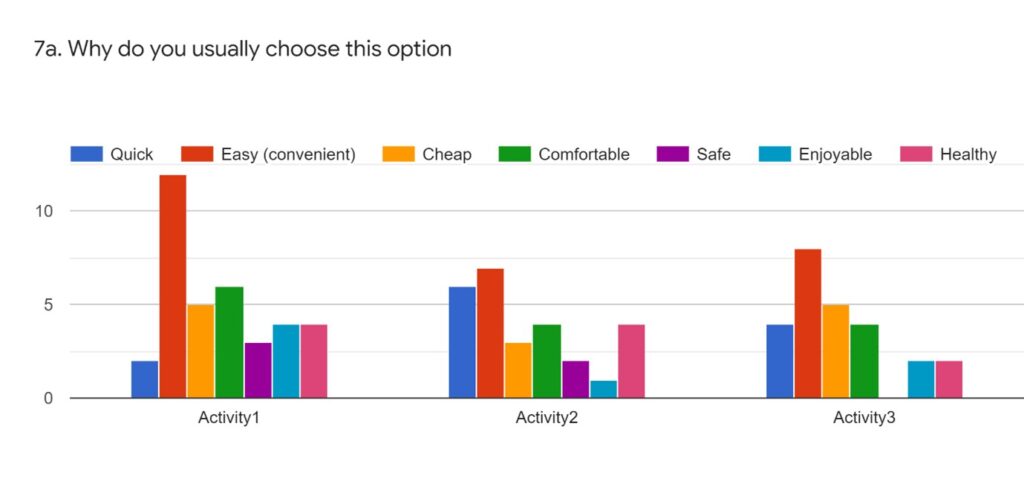
- 88 responses from 16 respondents
- EASE/CONVENIENCE is considered the main motivation for students choosing their mode of transport (27)
- Speed (12), cost (13) and comfort (14) are secondary motivations
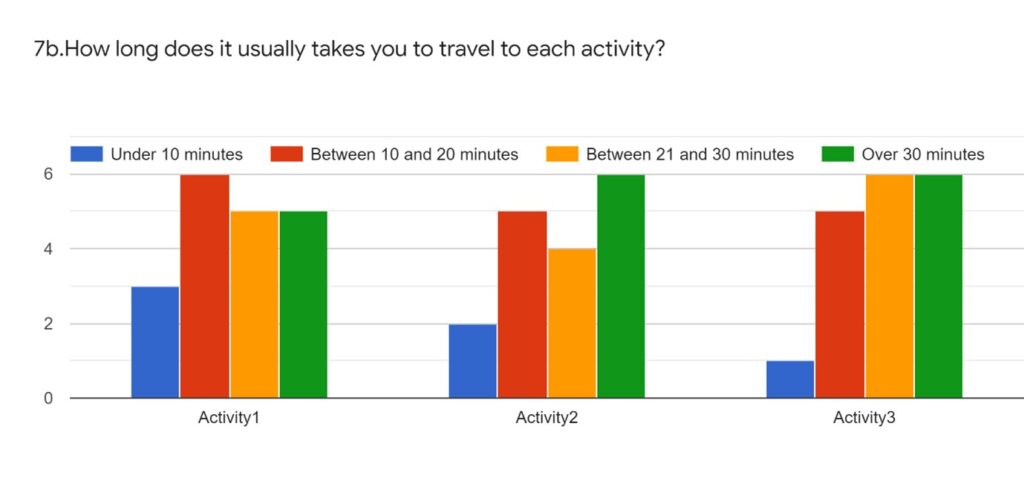
- 54 responses from 16 respondents
- Most of the activities require students to travel over 30 minutes (17)
- The least number of activities are located under 10 minutes travel time away (6)
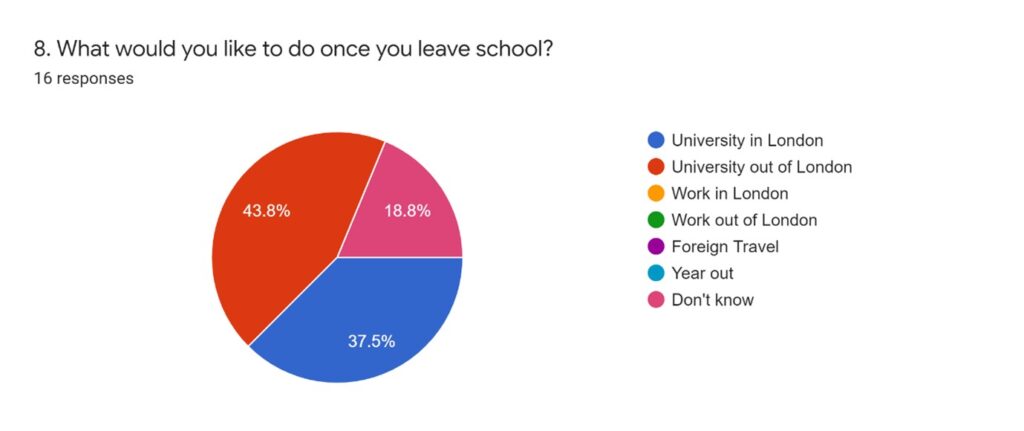
- The highest percentage of students (43.8%), want to attend university outside of London once they leave school
- Over a third of students (37.5%), want to attend university in London once they leave school
- Approximately a fifth of the students surveyed (18.8%), are unsure as to what they will do
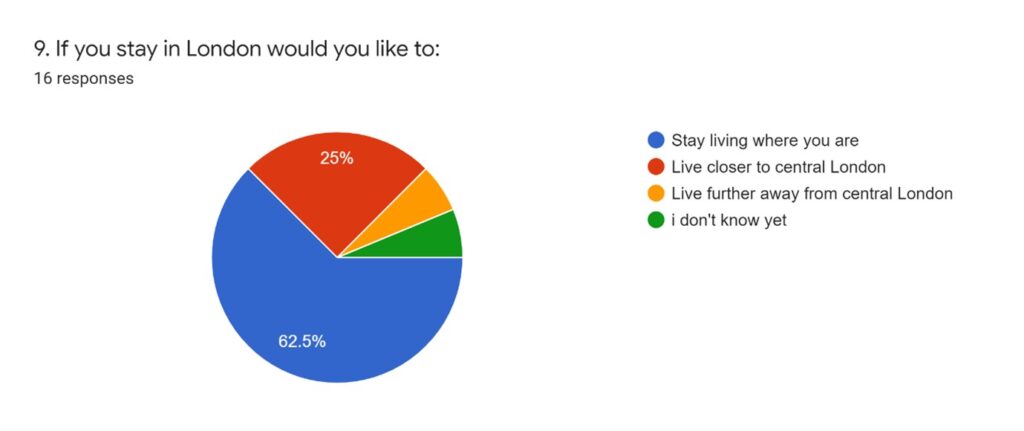
- Almost two thirds of the students surveyed (62.5%), would like to stay living where they are, if they were to stay in London
- A quarter (25%), would like to move closer to central London
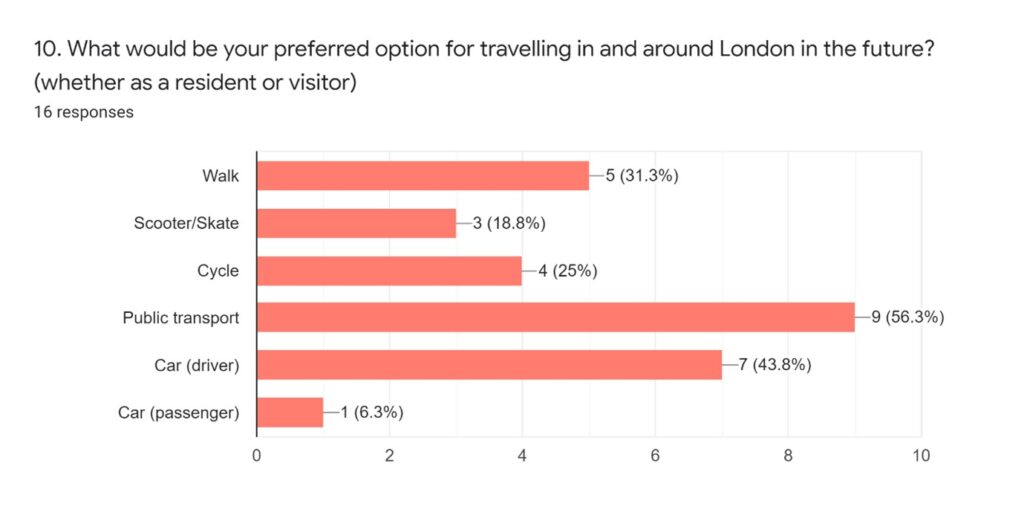
- 29 responses from 16 respondents
- Over half the students surveyed (56.3%) would prefer using PUBLIC TRANSPORT as one option for travelling in and around London in the future
- Just over one third of all responses received (9/29) would prefer using ACTIVE TRAVEL (walking & cycling) as an option for travelling in and around London in the future
- Half the students surveyed (50%), would prefer to use a CAR, as either a driver or passenger, as one option for travelling in and around London in the future

[…] choose public transport over other options for travelling in and around town in the future. The research, which surveyed people between 16 and 18, further suggested that ease and convenience were the main […]